One of the most essential components of a credible Content Marketing program is consistent and frequent measurement. The reason is simple. You won’t know what’s succeeding—or what’s not—without being able to easily review and measure your KPI’s.
These Key Performance Indicators | KPI’s can include everything from conversions, number of visitors to content, CTR (click-thru rate), time on page, comments, shares and much, much more. You should identify and set KPI targets for every content component or campaign that you create before it’s deployed on your, blog, through email, social media or on a related website.
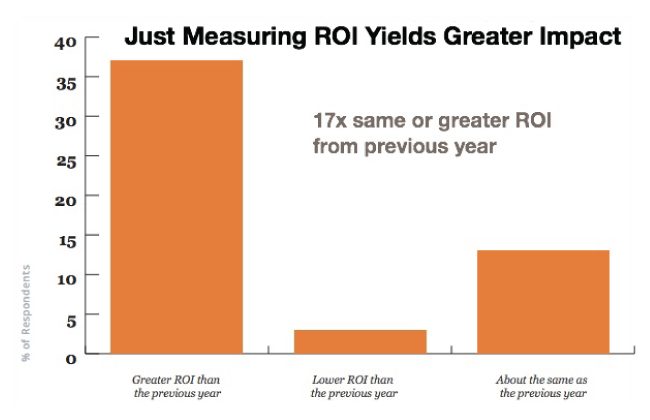
Still in the dark about what success looks like?
As Content Marketing advocate HubSpot reports, marketers who measure the ROI of their efforts are 17 times more likely to generate higher year-over-year ROI than those who don’t.
Why should you care?
Because measuring ROI isn’t easy or one-size-fits-all simple. In fact, according to Hubspot, only about half (53%) of marketers actually measure their online marketing ROI. As a result, the mere act of tracking ROI puts you ahead of over half of others engaged in Content Marketing.
Content Marketing analytics = not an option.
Tracking performance through data provides opinion-free guidance on how to plan, execute and distribute your content for the best results. And if you start to measure Content Marketing performance, you’ll have valuable insights on how your content creation effort and investments align with your key business objectives.
If you provide the kind of content that your prospects and customers actively seek, they’ll become more educated and knowledgeable about what you offer and how it helps them. The result is that you enhance the opportunity to get considered over others who are simply “yelling and selling” in an old-school attempt to win new customers.
Where to turn to measure your online marketing?
There’s no better place to start than at the dashboards. If you’ve been forward-looking, and have integrated a Content Marketing and Marketing Automation platform with your website and blog, congratulations!
Most of these software platforms have performance dashboards built into them that provide important KPI summaries including keyword search terms, pages/posts rankings for views, email open + click performance, lead scoring/ranking, and much more.
So whether you use Hubspot, Pardot, SharpSpring, or Eloqua, these software platforms are a great place to start. But all of this insight comes at a price. And the cost of these solutions can be a barrier for many.
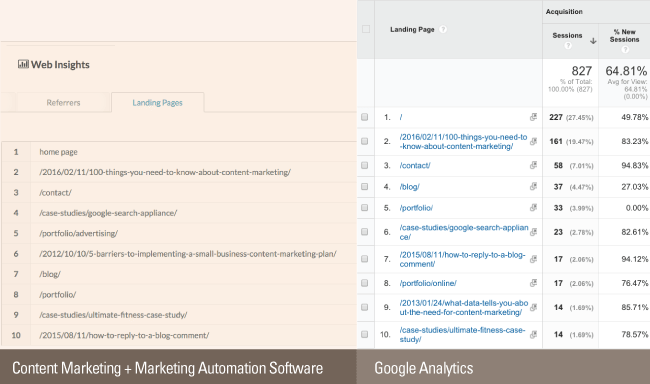
How come we’re not on the same page?
While any of the above platforms provide great utility, they, unfortunately, don’t line up 100% on every measurement with the other, more prevalent and free online measurement tool, Google Analytics.
Wait, you mean the KPI measurement in Google Analytics can be different from my expensive inbound marketing platform? How can that be? And how does each of these software providers measure things or report them differently? All good questions.
Google provides zero insight into how they calculate their measurement results. Their analytics run parallel with their AdWords platform, which as everyone knows, is shrouded in secrecy. What’s important to understand is that any web analytics data gathered, calculated, and aggregated by Google Analytics or any other platform will have inconsistencies from one to another.
What’s more, gathering impressions from browsers is anything but an exact science. As SharpSpring’s Chief Technical Officer, Travis Whitton, recently shared with me, there are a ton of technical nuances that can lead to discrepancies.
- Browser pre-rendering behavior and the accommodations that each platform makes to address this
- Cookie privacy, domain policies, and other security settings that each platfitsmploys with their own respective approaches or workarounds
- Session policies and the methodologies used to group and identify repeat visitors across both pages and sessions/visits
- Third-party plugins and other browser add-ons reducing the efficacy of a specific tracking code or pixel
- Browser quirks and differences in Javascript behavior across browser versions
- Whitelisting and blacklisting influences
- Differing algorithms used for aggregate calculations—remember, Google has their own proprietary algorithm and most assuredly it’s different from every other Content Marketing software platform
- Anomalies related to burst traffic
- Tracking technologies competing for resources during page navigation—like race conditions and more
Diversity yields slightly different data.
What’s essential to understand is that each inbound marketing or marketing automation software provider does the best job they can to gather every impression or action taken by your site visitors. And when compared against each other, or Google, the results are generally consistent with a reasonable level of accuracy.
However, the aggregate calculations and batch processing techniques that each of them use is assuredly different than how Google analyzes and serves up performance-related data. The bad news is that there’s no way around these potential inconsistencies or differing performance results.
The good news is that these web analytics are intended to provide a base level assessment of who’s visiting your site and what they’re actually doing. But that’s as far as they go. There are no guarantees.
And more importantly, measuring online marketing performance is not an exact science. That’s because there is no consensus or alignment by all software providers on how their actual analytics software code or approach measures up against the methods, algorithms, and techniques that Google uses.
Forget the minor differences, keep measuring.
It may be inconvenient that there’s no unchallengeable answer to each of your online marketing KPI’s. But that’s no reason to dismiss the analytics that your platform of choice delivers. Let’s not forget how poor or inaccurate “old-school” marketing measurement used to be. Think audience reach and frequency, Nielsen reporting, postal direct mail delivery, audited periodical reporting, blind calling surveys and more.
The ability to see and understand, in most cases, real-time performance results of your online marketing efforts is far and away a superior method of measuring any investment in marketing. And it’s only going to continue to get better and better—no matter which measurement platform you use to track performance.
Every provider has no choice but to improve their software accuracy and reporting dashboards in order to retain existing customers and acquire new ones.
So don’t despair. Keep your eye on what so many content marketers’s recognize as their greatest challenge: Creating content that’s so informative, unique and entertaining that your customers and prospects recognize and choose you as the “go-to” source to address their need or pain.
If you do that, the KPI’s you need to measure will keep moving in the “up and to the right” direction you’re hoping for.
How do you see it?
Have you seen inconsistencies in your analytics or KPI measurement from one platform to another? Time to share.

As president and creative director of TeamworksCom, Paul develops brand strategy, engineers content to express customer value and creates integrated online and content marketing solutions to help businesses succeed. Connect with Paul, send an Email, or just call 415.789.5830.
[…] Analytics […]